
Essential Questions: (updated 5/7/25)
- Where do earthquakes occur?
- How are earthquakes recorded and measured?
- What is the relationship between earthquake location and magnitude?
- How do earthquakes impact humans and the environment?
Objectives: Students will collect real time earthquake data for their assigned region of the world using data from the USGS, then color code earthquake intensities on a world map.
Materials:
- USGS Earthquake Data
- this link is set to the following settings: 30 days, 2.5+ magnitude, terrain, and no plate boundaries
- confirm tectonic plate boundaries are not on the map before sharing with students
- in the top right corner of the map is the ‘layers’ icon, you can customize the map
- Earthquake Data Mapping Activity (Google sheets)
- to edit this spreadsheet, make a copy for each map, then share editing rights with each group of students who will be working on that map
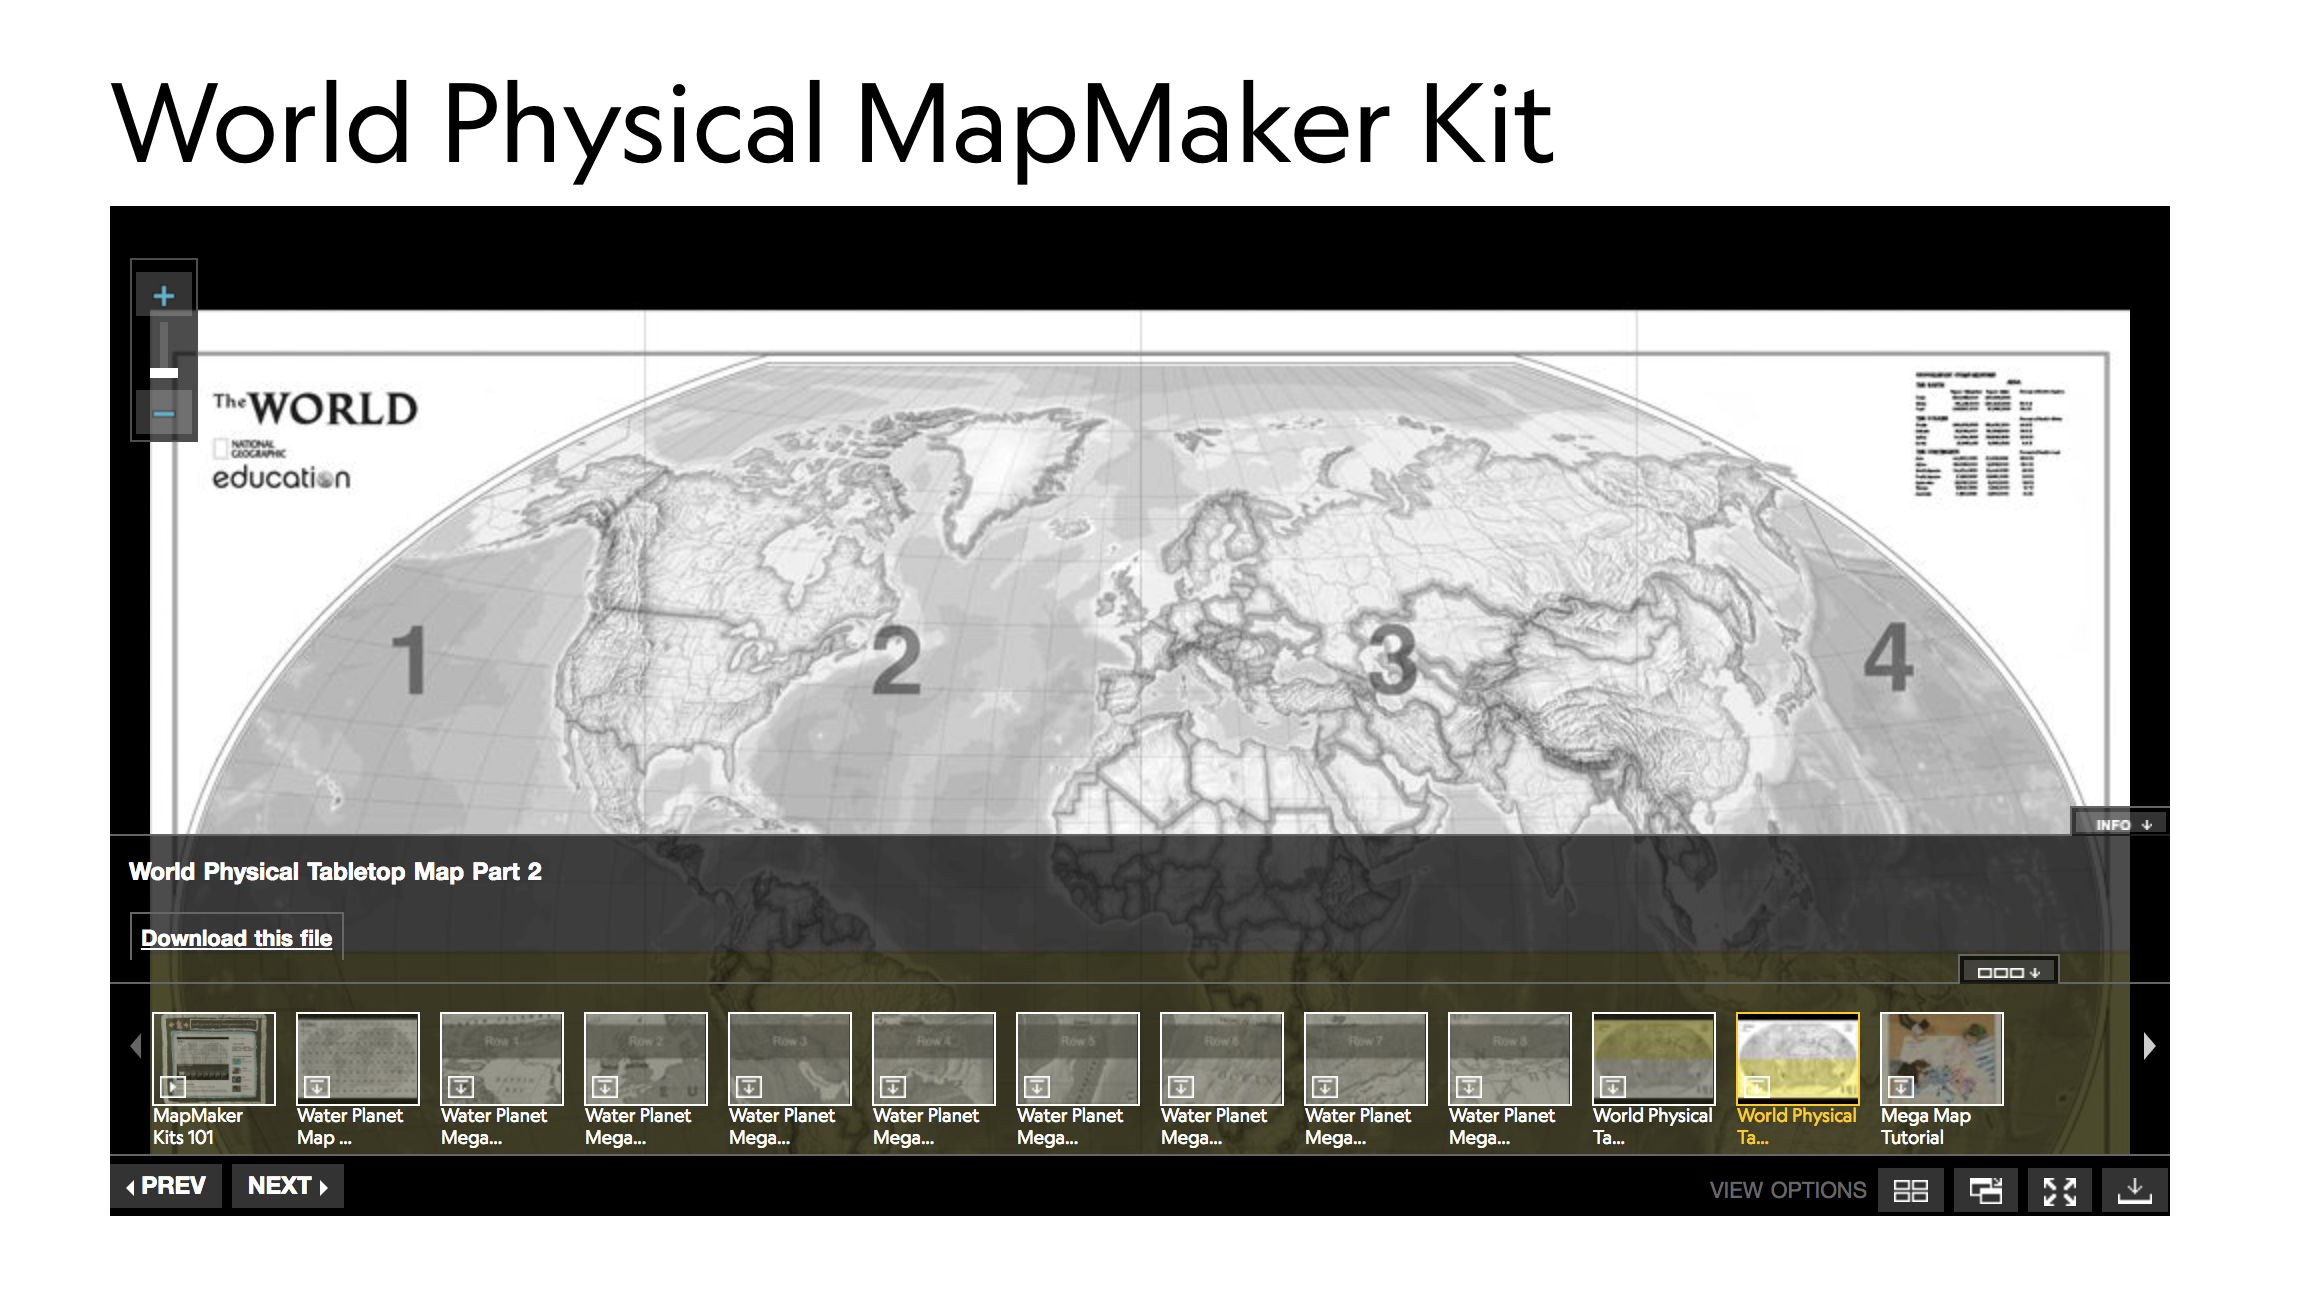
- 1 Table sized map per lab group (3-5 students) – printed and assembled
- The map will remain on the table, as the next class comes in, they will add the data for their assigned region(s) to the same map as the class before them
- ex: Map A data is shared with 4 students from period 1, 4 students from period 2, 4 students from period 3, 4 students from period 4, and 4 students from period 5. When done, they will have 200 EQs plotted and color coded on the table top map.
- Nat Geo is no longer hosting this printable 8 page latitude and longitude world map for free for educators, I can’t find any updated links to it, the closest is this map with flags, but it doesn’t have enough lat/long lines on it
- if you find a printable large map for free, please share the link in the comments below ☺️
- Colored pencils or markers per map
Procedures:
- Assemble one table map and materials per lab group.
- Show students how to use and navigate the USGS website, find EQ data, and how to record their data on Google Sheets.
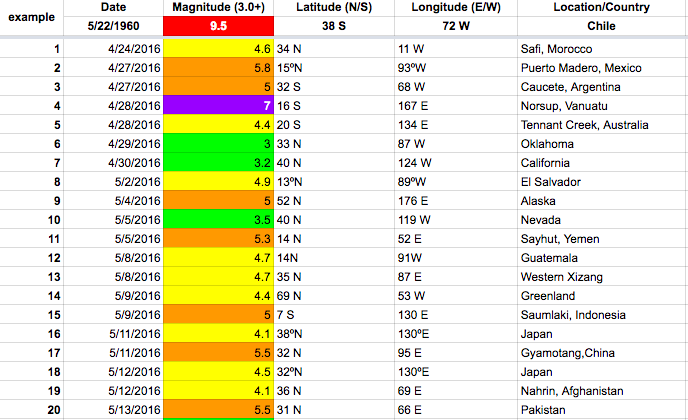
- Assign each group a map and 1-2 regions of the world. They will collect 25 data points for each region. They can choose any EQs over a magnitude of 3.0 for their region(s).
- Once they have all of their data, they will plot the EQs onto the table map. The magnitude of the EQ is the color they will plot onto the map.
- ex. Magnitude of 7.5 will be a purple dot
- Students will analyze their data and look for patterns
- What regions of the world have EQs?
- What regions of the world had more EQs? Less?
- What regions of the world had lower magnitude EQs? Higher?
- Why are EQs located where they are?
- etc…
- After this activity, I introduced Plate Tectonics and we discussed the relationship between EQs and tectonic plates.

Comments are welcome!