Comparing Surface Temperatures

Materials:

  • Heat lamp
  • Stand
  • Clamp
  • Infrared Thermometer
  • 6 beakers each of sand, water, gravel (other items can be used, or more than 3 can be added)
  • Meter Stick
  • Handout with instructions, data collection, and questions (Google Doc)
  • Google Sheet for graphing (Google Drive)
  • Newsela Reading – Heat Islands & Questions (Google Doc)

Directions:

Day 1:

Explore the campus on a sunny day and select both natural and manmade surfaces and record data. Enter data into spreadsheet – what patterns do you notice?

HW: Read newsela article and answer questions, discuss next class, how does this relate to our findings today?

Day 2:

Set up heat lamp experiment for a minimum of 25 minutes, make predictions, which surface will heat up the most? How hot will it get? What location (1-6)? Enter data and discuss results.

HW: Lab write up and discuss results next class

This was the first time I did this experiment, and seeing the results definitely had the ‘wow’ factor with my 6th graders, seeing the temps was actually surprising, esp for the rocks under the heat lamp. Many students thought the sand would be the hottest from their experience walking on hot sand at the beach in July/Aug. Also, the surface temp of the playground was surprising since it was a rubbery light colored composite and not dark colored asphalt. Prior to this activity, we took notes and discussed heat – radiation, convection, and conduction, and notes on sunlight and how it causes the seasons and different climates on Earth. Under the heat lamp, position 1 was analogous to being at the equator while position 6 was at the poles. The Google Sheets will automatically graph your results once the data is entered.

If you use this activity, would love to see your results!

Volume of a Penny Lab – New!

This slideshow requires JavaScript.

Problem: How can we use water displacement to calculate the volume of one penny?

Materials:

  • Volume of a Penny Lab (PDF)
  • Graduated cylinders (25 mL, 50 mL, or 100 mL)
  • Cup or beaker of water, food coloring optional
  • Pennies – 100+ per group
  • Tub
  • Plastic Spoon – to pour water out of graduated cylinder and separate pennies

Screen Shot 2019-10-18 at 10.33.54 PM

This is a simple & fun lab to have students practice measuring and reading volume as well as use water displacement to determine the volume of  a penny – an irregularly shaped object.

Students will design their own series of 10 tests with the following criteria:

  • All pennies must be under water inside of the graduated cylinder.
  • The volume of water must not pass the 100 mL (or highest) increment.
  • All data is recorded carefully.

Students were able to carefully measure and determine that the volume of a penny was 0.35 mL – most students were very close with a range of 0.33 – 0.37 mL.

https://www.instagram.com/peckscience/

Finding the Mass, Volume, and Density of Water Lab (Google Sheets)

Materials:

Goals

  • Students will practice their measurement skills using a graduated cylinder to determine volume and a triple beam balance to determine mass.
  • Students will determine the density of water by completing 10 trails and finding an average.

I use this lab to tie their measuring skills together and introduce the concept of density. We then do further explorations of density and practice using the formula.

This lab is a modified version of the lab posted at Middle School Chemistry – for further details about the lesson, please click on this link.

Making Predictions

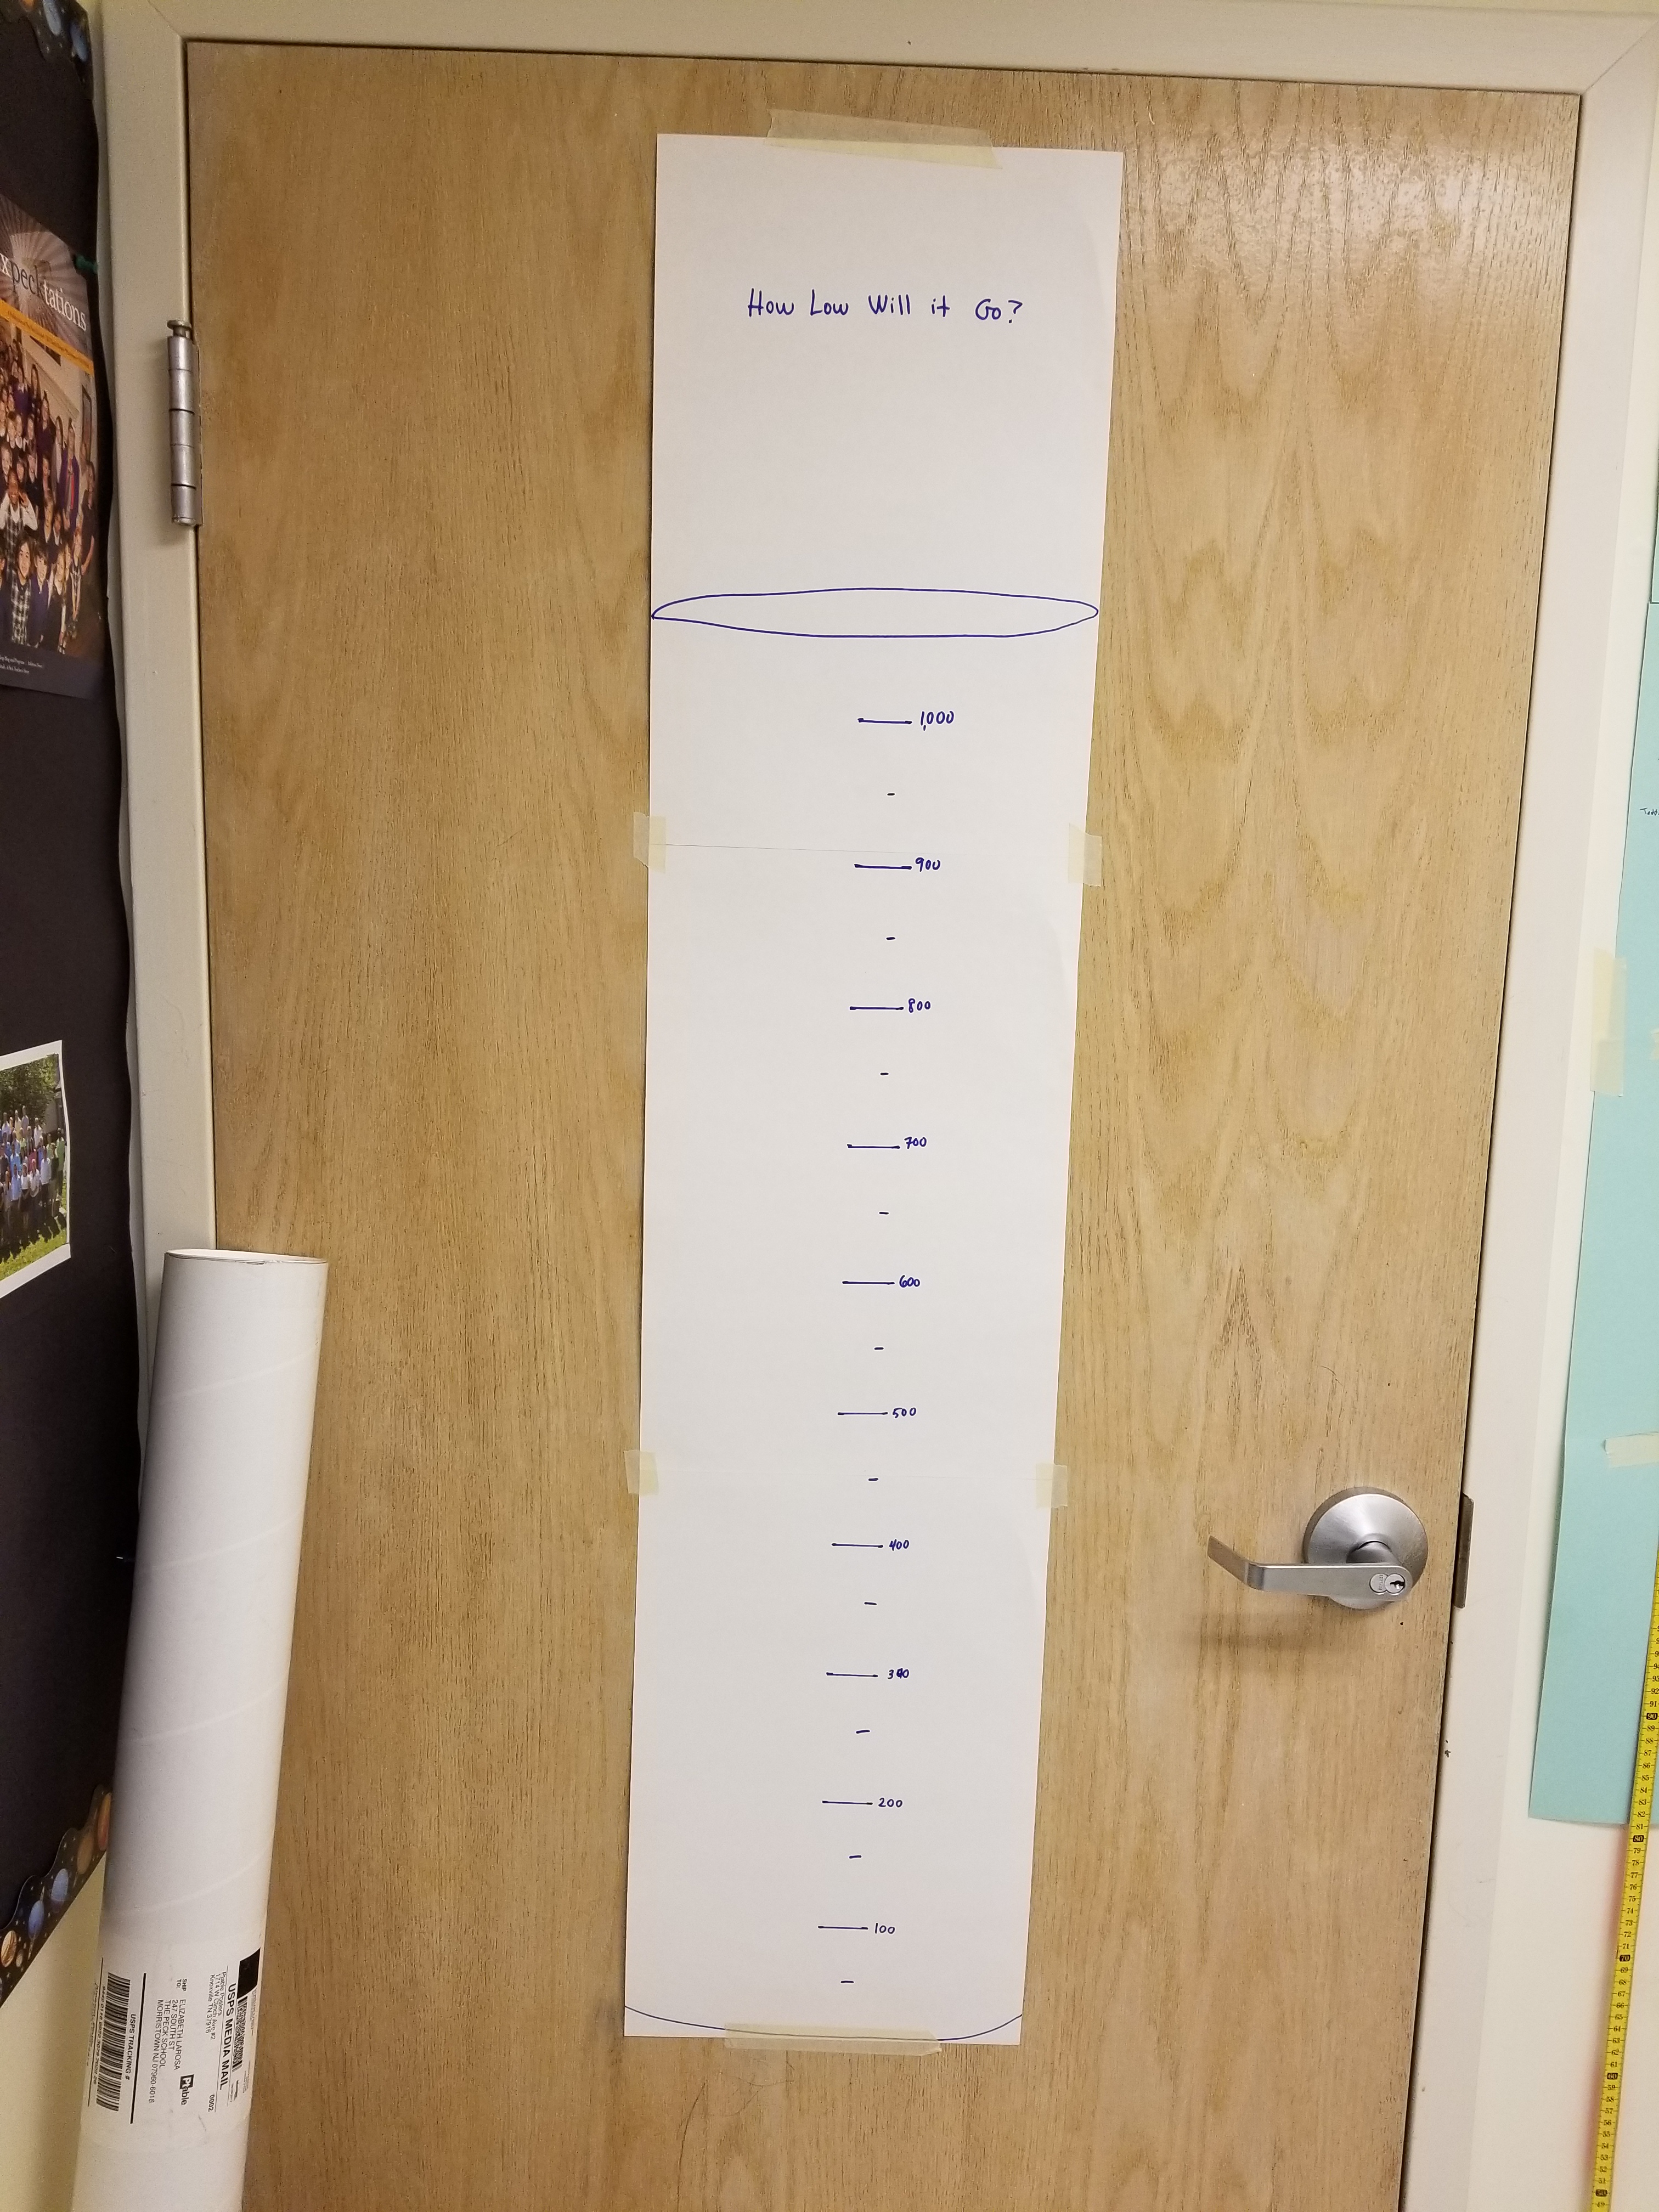
Here is a simple experiment to incorporate making predictions and reading graduated cylinders. I have two 1-Liter graduated cylinders set up, one in a glass cylinder with blue food coloring and one in a plastic graduated cylinder with green food coloring.

I filled both with water a few days before the start of school and an equal amount of drops of food coloring. Students will make predictions on small post-it notes and place it on the drawing of a large graduated cylinder. Where do they think the water level will be at the end of school? Will it evaporate before school ends? By what date?

I will also have them come up with factors that affect the rate of evaporation on larger post-it notes. What affects evaporation? Will the air in our classroom be drier in the Winter when the heat is on? Is our classroom humid now since it is warm out?

I will post their predictions and questions next week. At the start of the month, I will also post the volume so they can see the evaporation rates over time.

20170915_11082620170915_110819

Updated: Dunkin’ for Density using Google Sheets

Updated 2018 – Spreadsheet that will graph 20 trials, along with the Density of Water

Purpose: Change the density of the film canister so that 97-99% of the canister is suspending under water (very SLOWLY floating from the bottom to the top of the tank).

chart (1).png
Dunkin’ for Density 2018

Materials:

  • Film canisters with secure lids – one per student
  • small objects of different masses – pebbles, pennies, etc…
  • lunch tray to hold materials for each group of students
  • deep enough ‘tank’ and a spoon to fish items out
  • Triple Beam Balance
  • Towels
  • Google Sheets: Dunkin’ for Density Spreadsheet 2018
  • Google Doc Public Link – Student worksheet and directions

Set up hints – students prep items at their table then come up to the tank. After dunking, dry off with towels (I just drop it onto a thick folded up towel next to the tank). I have a bank of TBBs set up on the side of the classroom – students find the mass on their assigned TBBs then record results. Repeat trials. Towards the end of class, students enter all their data into the spreadsheet then I give them the volume of their film canister. Depending on the type of film canister, the volumes are about 39-41 mL. Confirm with a large graduated cylinder or water displacement tank.

dunkin_1


For more details about this activity, please see my original post. If you have used this lesson with your students, please let me know, you can post it on my Twitter feed @MSScienceBlog

Chocolate Chip Cookie Mining Simulation

cookiemining
Cookie Mining – with an example of cookies used for the activity.

Materials:

This is one of my favorite activities from our minerals and mining unit. It takes about 1 whole class period to explain the activity, collect data, eat the cookie (& crumbs), and clean up. We discuss our results the next class and determine who made the most profit.

When determining the value of the chocolate ore, I have the students place their chocolate pieces close together in one area of the map. When they are done, I go around and circle the area of chocolate and give their chocolate a rating. They count the number of boxes their chocolate covers and enter it into their spreadsheet.

If there are crumbs attached to the chocolate, I call that ‘slag’ and it lowers the value of the chocolate ore. This leads to a great discussion afterwards when we compare the profits and talk about land use. Is it better to get out as much chocolate as you can, even if you get a lot of slag, or is it better to remove just the chocolate even though you will have less in the end? How is this similar to coal mining? Diamond mining?

cookiemining2
Students try different techniques to extract the chocolate.

cookiemining3
Cookie blasting – extracting as much chocolate as you can in 5 minutes.


Density Bottles Demo

Density Bottles
Density Bottles: Sand, Air, Rice, Water, & Cotton Balls in 500 mL bottles

How to use density bottles:

Demo & Discussion – For this part of the lesson, students will not handle the bottles, they will answer discussion questions based on their observations only.

  1. Share observations about the bottles.
  2. What do the bottles have in common?
  3. What is different about the bottles?
  4. What do you think the original contents of the bottle were?
  5. What phases of matter are shown?
  6. Are any of these bottles empty? Explain.
  7. Do all of these bottles have air in them?
  8. Which bottle has more air in it: Cotton Balls or Water? Explain.
  9. Which bottle is filled the most? Least?
  10. Which bottle has has the most ‘stuff’ in it? Least?
  11. Which bottle is the heaviest? Lightest?
  12. How would you order these bottles from lightest to heaviest?
  13. Estimate the mass of each bottle in grams.
  14. Which bottle is the densest?
  15. How would you arrange these bottles from least to most dense?
  16. Which of these bottles can have more of the same ‘stuff’ added to the inside of the bottle? Explain.
  17. Which bottle(s) would float in a tank of water? (I do this at the very end of the lesson with everyone at the sink)

Hands On Exploration

  1. Each group will have one set of bottles or take turns using the demo bottles and sharing their findings.
  2. Using a triple beam balance, the volume of the bottles, and a tank of water, answer as many of the questions above as you can. (for our calculations, we use the volume of the bottle’s original content (500 mL of sport drink) to give us an approximate density, not the actual density – for comparison purposes only)
  3. How did your findings compare to your observations and predictions?
  4. Dunk tank – time to find out which one will float!

Further Exploration

Give each group of students a new set of bottles (ones that they have brought in from home) and have them make observations, predictions, and density calculations.

Additional Bottle Ideas:

  • Rocks/pebbles
  • laundry detergent – liquid or powder
  • paper clips
  • paper shreds
  • crayons
  • marbles
  • flour
  • bread crumbs
  • coffee beans
  • beans
  • different shapes of pasta
  • pom-poms
  • pop corn kernels or popped
  • Lego pieces
  • salt
  • dish-soap
  • beads
  • yarn/string
  • etc…

Have each student bring in a bottle from home filled with the contents of their choice so that you have enough bottle to compare. Match similar bottle shapes/sizes together for each group or match similar contents in different sized bottles for comparison.

You can also use these bottles as part of a Triple Beam Balance Activity (blog entry).

Reading a Graduated Cylinder- Volume & Displacement Free Online Resources

(For lessons and resources on finding volume using water displacement, please see my earlier blog entry)

Resources: Updated links 11/20/18

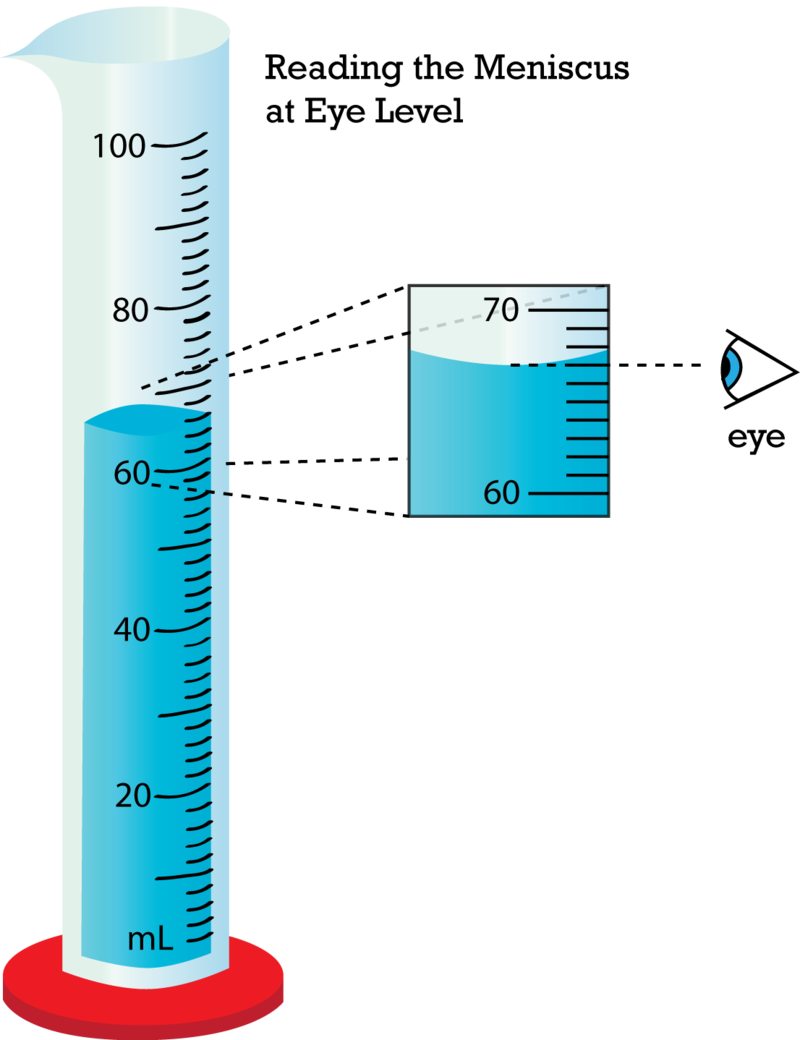
  1. Reading Graduated Cylinders – (FREE) A nice power point presentation from Teachers Pay Teachers to introduce students to reading graduated cylinders (link)
  2. How to Read Liquid Volume video (link)
  3. Common Core Worksheet – link
  4. Reading Graduated cylinders – link
  5. Super Teachers Worksheet – practice problems (pdf)
  6. Science Starters/Warm Ups/Do Nows: (Graduated Cylinder ppt), (Beaker/Erlenmeyer ppt)

Tips:

  • The graduated cylinder has markings, like a ruler, to measure volume for water and other liquids
  • I like to use food coloring and water for the students to practice their measurements, it makes it easier for them to read the values, plus it adds some pizzazz to the lab.
    • I mostly use either blue or green food coloring, the red can stain, yellow is not dark enough.
  • Place all materials on a lunch tray for each group to contain spills and make for a very easy clean up.
  • Glass graduated cylinders can break if knocked over, plastic is more durable but can be harder to read.
  • Have students explore how to use read and use graduated cylinders:
    • Students can explore handling and pouring water into the graduated cylinders and reading the values.
    • Once they have mastered pouring and reading, they can practice measuring specific volumes such as 10 mL, 20 mL, 42 mL, 58 mL, etc into the graduated cylinder.
    • You can also set up stations with pre-measured graduated cylinders and have them practice reading the volumes.
      • Have cylinders of different sizes and increments to make it more challenging.
      • You can place task cards/answer keys at each station so students can self check once they have made their readings for immediate feedback.

Image Source: CK12

Dunkin’ for Density Challenge

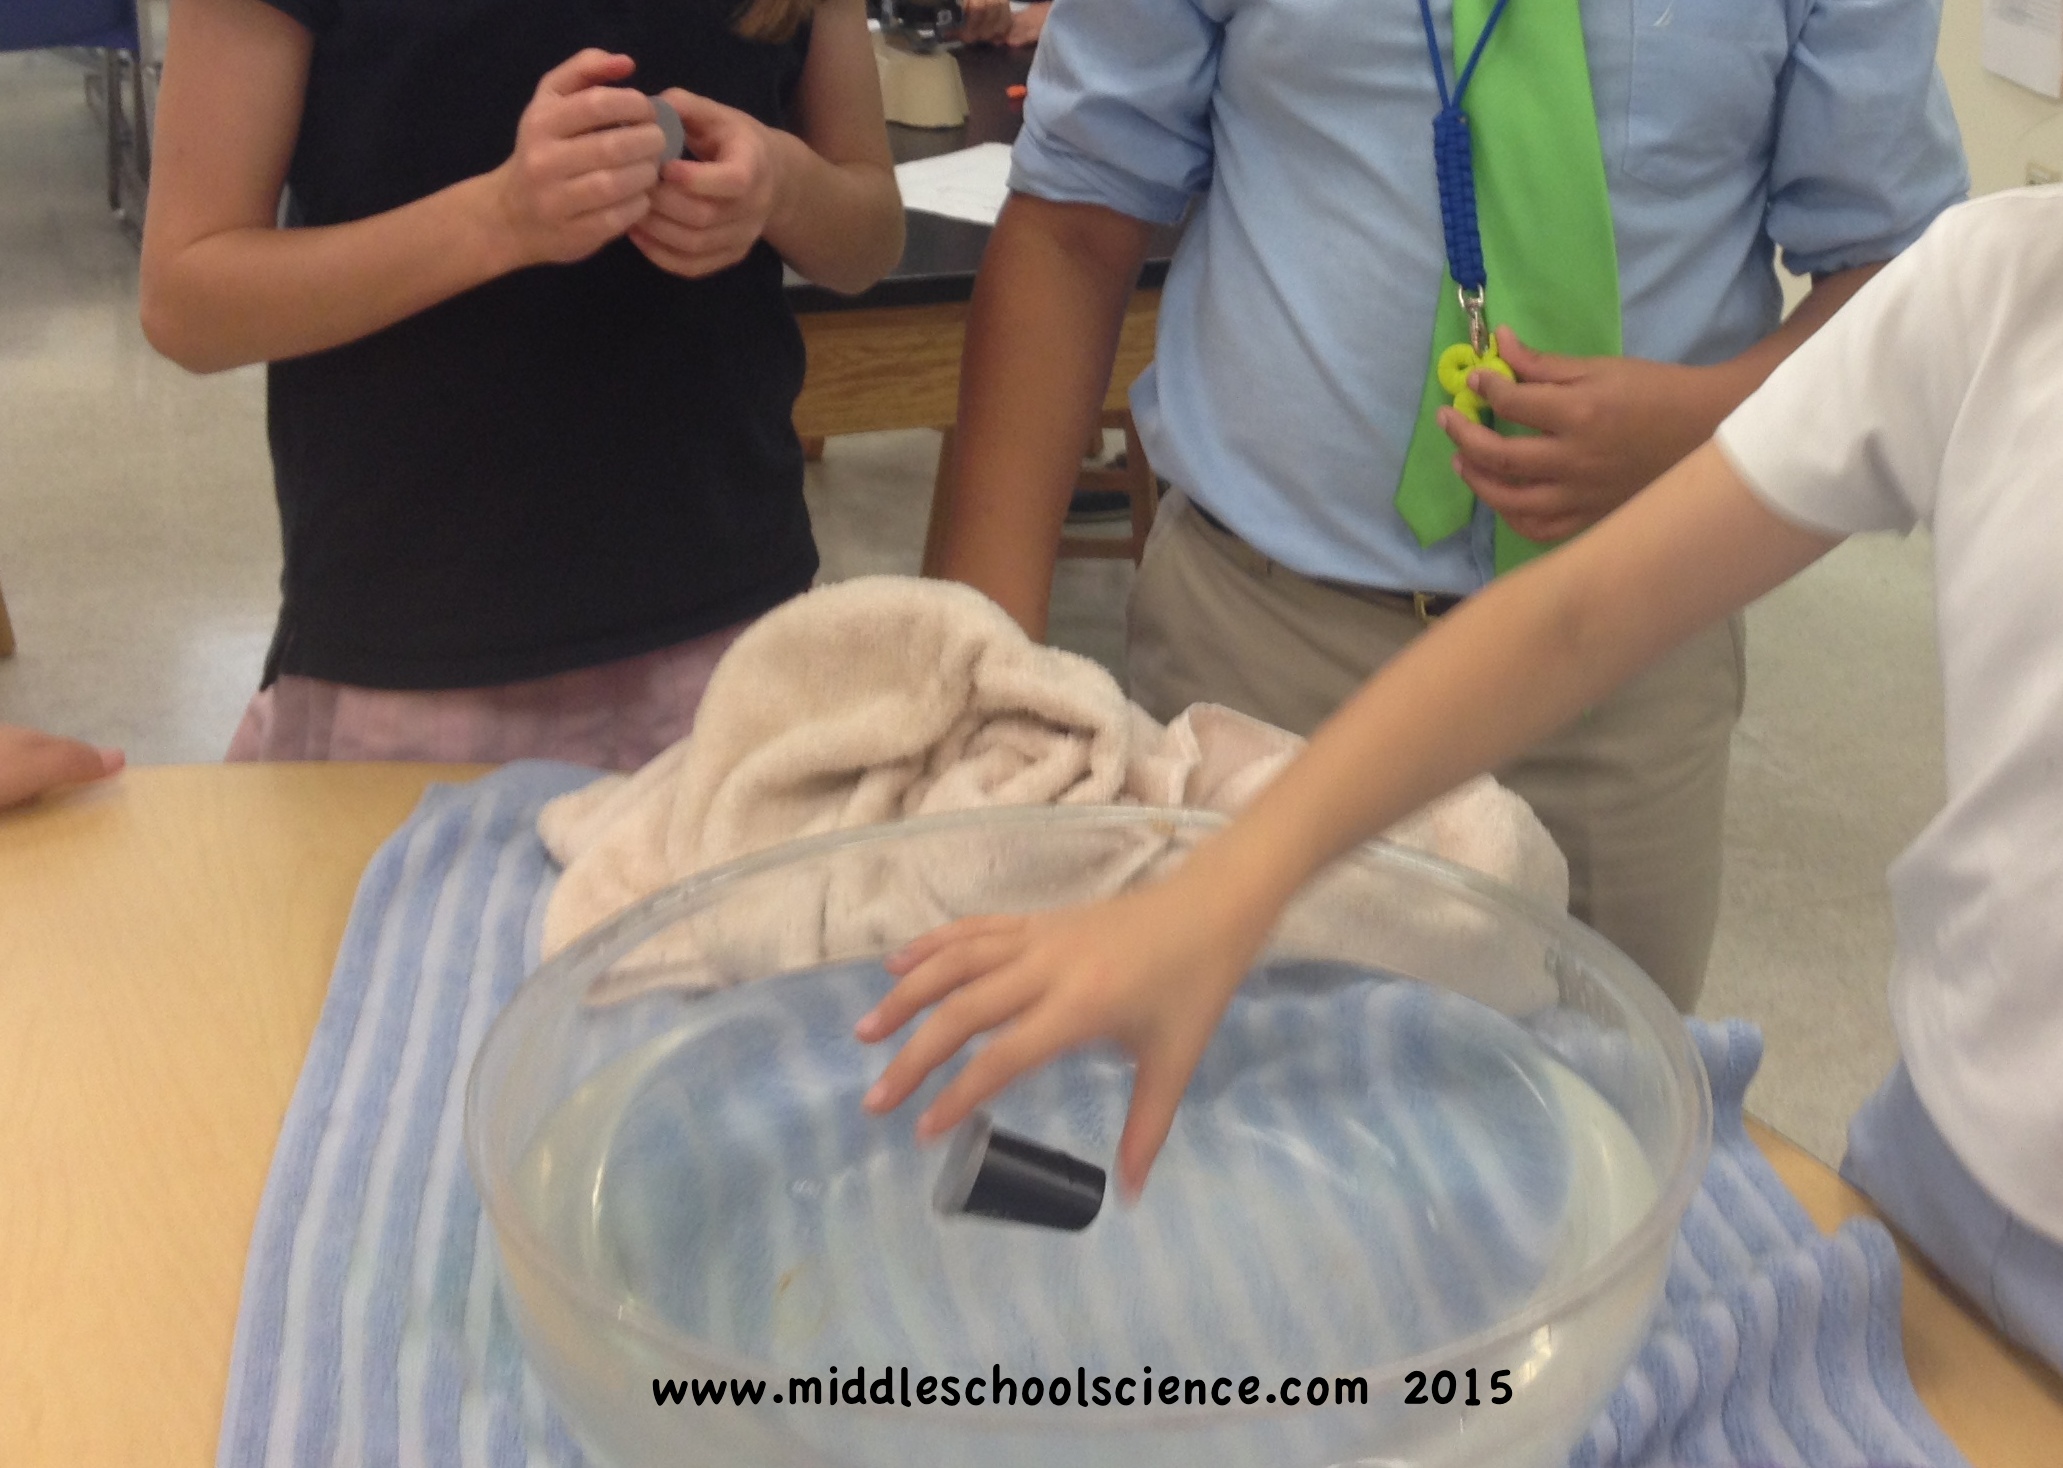
Dunkin' for Density - finding the mass after the dunk tank.
Dunkin’ for Density – finding the mass after the dunk tank.

Updated for 2016: See blog entry

Introduction:

This is a wonderful problem solving and hands-on activity to use as part of your density unit. The students enjoy the challenge and have a solid understanding of density after completing this activity. Even though students quickly figure out how to make the canister float and sink, making the canister suspend is pretty challenging and requires a lot of trial and error and problem solving.

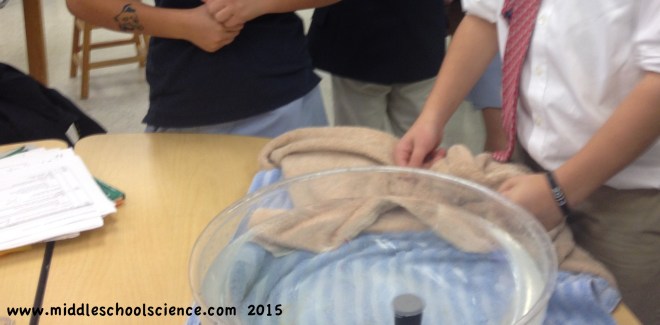
To qualify as suspending, the film canister needs to float just under the surface of the water, with a small portion of the top just breaking through. How I also verify that it is suspending is by pushing the film canister to the bottom of the tank, if it comes up very slowly to the surface, it counts – if it comes up quickly or stays towards the bottom, it doesn’t count. Students then need to figure out that if it comes up too quickly, they need to add to the mass, if it comes up too slowly, they need to remove some of the mass. It will take several tries to get it just right.

dunkin_1

Materials:

  • Dunkin’ for Density handout (1 page pdf) or (2 page pdf) and (link) to the original lesson from ScienceSpot.net
  • Triple Beam Balances
  • Container filled with water
  • Towels – the more the better!
  • Film canisters
    • one canister per 2 people works well, they can reuse the canisters if you don’t have enough to give each set of lab partners 3 canisters
    • if they reuse the canisters, be sure that they find the mass before they empty the contents
  • An assortment of small objects such as pennies, paper clips, stoppers, small pebbles, etc…
  • Calculators

dunkin_2

Procedures:

  1. Introduce the Dunkin’ for Density Challenge – their goal is to make the film canister float, suspend, and sink by placing contents inside of the film canister.
    1. Many students will say that the canister will float with nothing in it, but they must place a few objects in it for it to count 😉
    2. On a side note, a mini history lesson on film and cameras is fun to discuss since most students have never used a camera that used film
  2. Explain the procedures, review how to use the TBB, note that the film canister must seal completely and be air tight so that water doesn’t enter, and also demonstrate how to use the dunk tank properly and to dry off the canister before finding the mass.
  3. Do not give the students the value for the volume of the film canisters until they have collected their data. If the students know the volume of the film canister, they may figure out the mass needed to make the film canister’s density close to 1.0 g/cm3.
    1. The value is approximately 39 mL or 39 g/cm3 – verify with a large graduated cylinder that the film canister can fit inside of – or use an overflow can to find the volume (link).
    2. I will give the volume to each set of lab partners individually and ask that they don’t share that information with the class.
  4. Once students have calculated the density, collect class data on a spreadsheet projected on the board/screen.
  5. Discuss results – why did the film canister float, suspend, or sink in the tank of water? What relationships did you notice?

dunkin_results
Results show that densities close to 1.0 g/cm3 suspended.

For more lessons related to the Properties of Matter, click here (link)

‘The Goat by the Water’ : Observation vs Inference (Originally named ‘The Boy in the Water’)

goat_boy_water_observations
Image Source: Project Archaeology

Materials: (Updated July 28, 2017)

  • Updated worksheet for students to use for this activity (Public Google Doc)
    • Changed it from “The Boy in the Water” to the “The Goat by the Water”
    • Changed references from ‘boy’ to ‘kid’ and his/her for gender
    • my students alway bring up that we infer that it is a boy, but it could be a girl, too, and they are right!!
    • also remind them that a ‘kid’ is a baby goat, the goat in the picture has horns 😉
  • I also created Google Slides for this activity (Public)
    • improved answer key
    • also added a ‘make your own inference’ slide at the end
  • The original worksheet(pdf) for this activity is from Project Archaeology (link)

Students often have difficulty distinguishing between observations and inferences, they often combine the two into one statement. For example, when asked to make an observation using the image above some students might say: “The kid fell into the water because the branch broke.”  

Instead, they should say “there is a kid in the water” and “there is a broken branch” as two separate observations. There is no “why” in the statement. Another student may say: “The goat pushed the kid into the water when he/she was trying to pick up his/her sailboat.” This is not an easy habit to break and takes some practice.

We then discuss the difference between the facts and the “story” that goes with it. The facts are our observations and the story is how we piece the facts together, or our inference.

Observations:

  • There is a kid is in the water
  • There is a goat is standing next to the water
  • There is a broken tree branch
  • There is a sailboat is floating in the water

Inferences:

  • The branch broke when the kid was sitting on it, and s/he fell into the water.
  • The goat butted the kid into the water when s/he was picking up her/his sailboat.

After defining and discussing the differences between observations and inferences, students will have a chance to work with their partner to practice identifying and classifying the statements related to the image of the boy in the water. Once everyone is done, as a class, we then discuss each statement and confirm each as either an observation or inference.

On your worksheet, use the picture of the kid in the water to determine if the statements are observations or if the statements are inferences. Place an “Inf” in the blank for inference and an “Obs” in the blank for observation.