Adopt-a-City: Weather Report Summary

My 6th graders completed their Adopt-a-City unit and wrote their weather reports comparing the weather in Morristown, NJ to their adopted cities. Students transferred their data to the following Google Sheet Template and then analyzed their data to write their weather reports using Google Docs.

  • Google Sheets Template for Weather Report (link)
  • Google Doc Template for Weather Report (link)
  • Adopt-a-City Unit with resources (page)

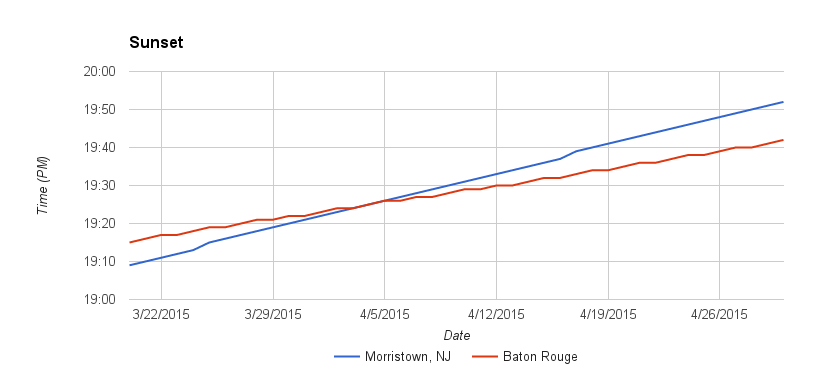
Overall this was a successful unit. The students enjoyed having an independent study based classroom experience and working at their own pace. They worked cooperatively with their peers and were able to explore each topic in depth with the provided resources. They also learned so many valuable skills and had a real understanding of weather. Below are some sample graphs for different cities:

image (9)
Morristown, NJ and Butte, MT
Sunset Times
Morristown, NJ and Baton Rouge, LA
image (5)
Morristown, NJ and Miami, FL
image (3)
Morristown, NJ and Seattle, WA
humidity
Morristown, NJ and Las Vegas, NV
Moon Rise
Morristown, NJ and Baltimore, MD

Pacing for Adopt-a-City Unit – students collected data and created Mini-Maps at the start of each class, and they updated their weather data over the weekends. I checked mini-maps and gave a daily grade of 5 pts per map completed and graded completed tasks as they handed them in. I also graded weather data for completion to be sure their data was up to date. Having a shared spreadsheet, with tabs for each student in the class, made it easy to quickly check each student’s data. I also added quizzes to check for understanding along the way. Their weather report was weighted as a test grade.

  • Day 1: Tasks 1-2
  • Day 2:  Tasks 2-3, HW Task 2 completed
  • Day 3: Tasks 3-4-5, HW Tasks 3 & 4 to be completed
  • Day 4: Tasks 4-5-6, HW Task 5 to be completed
  • Day 5: Tasks 6-7, HW Task 6 to be completed
  • Day 6: Tasks 7-8
  • Day 7: Tasks 7-8, HW Task 7 part 1 to be completed
  • Day 8: Tasks 7-8, HW Task 7 – complete Part 2
  • Day 9: Tasks 7-8-9, HW Task 8 to be completed
  • Day 10: Tasks 8-9-10
  • Day 11: Tasks 9-10-11, HW complete Task 9
  • Day 12: Tasks 10-11
  • Day 13: Tasks 10-11-12, HW complete Task 10
  • Day 14: Tasks 11-12-13
  • Day 15: Tasks 11-12-13, HW complete Task 11
  • Day 16: Tasks 12-13
  • Day 17: Tasks 12-13-14, HW complete task 12
  • Day 18: Tasks 13-14
  • Day 19: Tasks 13-14-15, HW complete task 13
  • Day 20: Tasks 14-15 or begin Weather Report, HW complete task 14
  • Day 21: Task 15 or begin Weather Report, HW complete task 15
  • Weather Report due x/xx/xx
Advertisement

8 thoughts on “Adopt-a-City: Weather Report Summary

  1. Tyne June 15, 2017 / 11:47 am

    Hi Liz,

    If this is an independent study, how much of each class period was given to this activity each day or were they expected to complete the tasks on their own time outside of class? I’m interested in using this with my 7th graders as we work through weather, but I’m wondering if I can model how to collect the data in class and after trouble-shooting with them…move on to a new topic (regional climates) with this being an independent project. We are a 1:1 school, so all students have their own laptop that travels with them to/from school

    Liked by 1 person

    • Liz LaRosa June 17, 2017 / 1:00 pm

      Tyne, When I used this, we devoted about 5 weeks to it, and used the whole class period. I set benchmarks that the kids had to reach each week, and they could work on it outside of class if needed. I also met with kids during the period to check on their progress. Hope that helps 🙂 Liz

      Like

  2. Kacie March 10, 2017 / 6:32 pm

    I am really looking forward to trying this activity with my 6th graders. Do you have any copies of what a finished final copy looks like?

    Like

    • Liz LaRosa March 14, 2017 / 12:05 pm

      Kacie, Sorry, I don’t have any reports I can share, but I did post some of the student’s graphs as examples.~Liz

      Like

  3. Tanya Baumgardner January 17, 2017 / 7:11 pm

    I am so in love with this activity! I’ve modified it a bit to fit our needs when studying seasons and am pretty happy with all but one piece – the time variable on the y-axis on the chart. From your template I get it in 24 hour time, but your beautiful graph shows it as hours and minutes on a 12 hour clock. Do you have any suggestions for how to change the increments on the axis?

    Like

    • Liz LaRosa January 20, 2017 / 11:57 pm

      That’s really odd, my y-axis changed and is incorrect and I am not sure how to fix it, it was correct when I posted it last year. I will play with it and see if I can modify it. Thanks for pointing that out! Liz

      Like

  4. Terrie Hardy February 10, 2016 / 6:30 pm

    Hi Liz,

    I really love this activity. You have done an exceptional job creating it. I want my students to be able to experience it as well. I don’t quite understand how to implement it from start to finish. Could you allow me to send you some questions that I have privately?

    Thank you so much for your time.

    Like

    • Liz LaRosa February 13, 2016 / 2:17 am

      Hi Terrie, thanks for your note 🙂 When I used this with my 6th graders, I ran it as an independent study and gave them due dates to complete certain task every so many days. I would check in with each student to monitor their progress. I would suggest that you talk to your peer science teachers or your science department chair to go over the activity and how you would want to implement the lesson in your classroom. They would be useful resources to bounce ideas around with. Once you start using the lessons you can make modifications that would best fit your students and your classroom needs. ~Liz

      Like

Leave a Reply

Fill in your details below or click an icon to log in:

WordPress.com Logo

You are commenting using your WordPress.com account. Log Out /  Change )

Facebook photo

You are commenting using your Facebook account. Log Out /  Change )

Connecting to %s