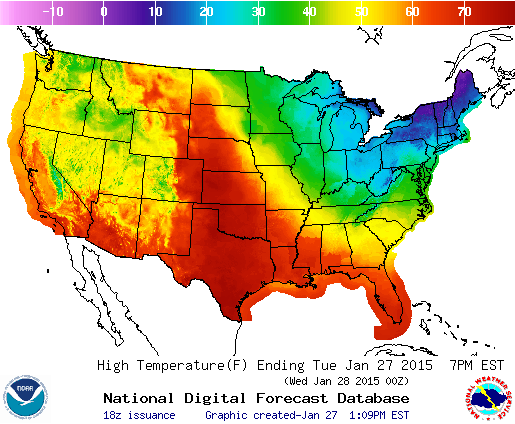
Looking at today’s weather map inspired me to dig out a lesson on reading and drawing isotherms. I haven’t taught weather in a very long time, but plan to in the spring, and was happy to see that this interactive website was still up and running (link) after all this time.
I really like this interactive tutorial for drawing isotherms because after a student has drawn their line, they can immediately check their work by comparing the line they drew to the line drawn by the computer. They have instant feedback and make adjustments if needed. Then they draw the correct line on their worksheet and try the next one using what they just learned.
After students are done with the online tutorial, they can try creating their own lines on a map of the USA for additional practice.
- This is the worksheet for the website and the practice map
- Updated 3/7/18 interactive map link: http://learningweather.psu.edu/node/13
- UPDATED 1/26/23 – Flash is no longer supported but here is a YouTube video that shows how to draw the lines on the practice map.
- For related lesson plans, please visit my Earth Science page.
- Follow me on Twitter: https://twitter.com/MSScienceBlog

Comments are welcome!